
50+ Headless CMS Migration Statistics in 2026: Timelines, Costs, Risks, and ROI
Migrating off a legacy CMS is where most headless projects actually go wrong — not in the architecture decisions, but in the parts nobody puts in the RFP: how long content migration really takes, what happens to search rankings for six months, and why “on time and on budget” is the exception rather than the rule. The Standish Group has tracked project delivery for three decades and the on-time/on-budget/in-scope rate has barely moved from 31% (37).
This report pulls together migration-specific data — not general headless-CMS adoption numbers — from Google’s own Search Central documentation, large-sample SEO recovery studies, McKinsey’s IT-project research, and more than 35 vendor-published migration case studies with actual before/after numbers, to answer the question every stakeholder asks before signing off: how long will this really take, what will it cost, and what can go wrong.
Top Headless CMS Migration Statistics
- Only 31% of software projects finish on time, on budget, and within scope — a figure that has held roughly steady for three decades of Standish Group CHAOS Report tracking (37).
- 53% of CMS migration initiatives exceed budget, miss deadlines, or fail to deliver expected outcomes, per Forrester research (2).
- Analyzing 892 domain migrations, it took an average of 523 days for organic traffic to fully return to pre-migration levels, and 17% of migrations never recovered even after 1,000 days of monitoring (11).
- 68% of CMS users have migrated to a new CMS platform within the past three years, and 74% of non-headless users say they’re likely to switch within the next two years (26).
- A documented WordPress-to-headless migration of 1,200 pages cut mobile load time from 4.8s to 1.9s (-60%), Time to First Byte by 94%, and bounce rate by 29% (13).
- Technical debt now accounts for 21–40% of an organization’s total IT spending, and unmanaged content debt alone is estimated to cost enterprises $4.63 trillion globally — $663.4 million per organization on average (32, 35).
- Among more than 5,400 large IT projects tracked by McKinsey and Oxford’s BT Centre, the average project ran 45% over budget and 7% over schedule while delivering 56% less value than predicted (18).
- Pirelli migrated 218 websites across 6 core digital assets and 150 regions in 10 months with a 13-person team — ahead of its own 12-month target (45).
- 99% of companies that switched to a headless CMS report measurable improvements, and 79% say their original pain points were mostly or entirely resolved (26, 41).
- The average cost of one hour of downtime now exceeds $300,000 for over 90% of mid-size and large enterprises (20).
Migration Timeline Statistics
How long a migration actually takes, according to agencies, vendors, and independent studies:
- A single-site CMS migration with up to 5,000 pages typically completes in around 10 weeks, while multi-site enterprise migrations take 12–20 weeks (1).
- Mid-market CMS replatforming projects typically run three to six months end-to-end; enterprise projects take six to twelve months (2).
- A more granular breakdown: small marketing sites take 4–8 weeks to build (12 weeks total with content migration), mid-size sites of 50–200 pages take 2–4 months (5–6 months with complex integrations), and enterprise or e-commerce builds take 4–6+ months.
- Manual content migration takes roughly 15 minutes per “easy” page, 25 minutes per “medium” page, and 45 minutes per “hard” page depending on content-type complexity — and migration timeframes are almost always underestimated at the outset (4).
- Google itself states a medium-sized site can take “a few weeks or more” to fully show new URLs in place of old ones after a migration, with larger sites taking longer (16).
- Enterprise-level migrations are generally defined as those involving 100,000+ URLs, where hand-mapping redirects becomes impractical past roughly 10,000 (17, 7).
Migration Cost & Budget Statistics
- 2026 CMS migration cost ranges from roughly $10K for a small marketing site to 10K–30K for a mid-size site (50–200 pages), 30K–80K+ for enterprise/complex projects, and 40K–80K+ specifically for e-commerce migrations (2).
- Enterprise CMS migrations commonly land in the “mid-to-high six-figure range, and occasionally into the millions” — page count alone doesn’t determine cost; an 8-locale, 500-page site with multiple integrations requires far more budget than a single-locale 500-page site (7).
- Redirect-storage limits (commonly 50,000–100,000 entries) typically begin restricting enterprise commerce platforms like SAP Hybris and Salesforce Commerce Cloud once a migration crosses that URL threshold (7).
- Recommended contingency buffer for a CMS migration budget is 15–20% for unexpected expenses (5).
- Businesses running a headless CMS spent an average of nearly $88,500 less on total CMS ownership costs (implementation, annual maintenance, training/support) than businesses on legacy systems, in a survey of 43 companies with 5,000+ employees (33).
- Nearly 60% of SAP migration projects were delayed and over budget, per ISG research — cited as a comparable data point for the scale of replatforming budget risk generally (8).
- Technical debt remediation now consumes an average of 30% of IT budgets, and 51% of companies dedicate more than a quarter of their annual IT/engineering budget to it — money that competes directly with migration budgets (30, 31).
Why Companies Migrate: Technical Debt, Content Debt & Triggers
- Technical debt carries an estimated $1.52 trillion cost to the U.S. economy alone, based on a survey of 1,000+ U.S. architecture, dev, and engineering leaders (31).
- The average global enterprise wastes more than $370 million a year through inability to efficiently modernize outdated legacy systems, and 78% of IT decision-makers agree the time spent maintaining legacy systems could be spent more productively elsewhere (29).
- Content debt costs enterprises $4.63 trillion worldwide — $663.4 million per organization on average, or 5.9% of annual revenue at risk — and 78% of executives say their organization carries more digital content than it can realistically keep accurate and up to date (32).
- 69% of enterprises say their content strategy has become more of a technical challenge than a creative one, and organizations spend over 100 hours a week auditing, correcting, and updating existing digital content (34).
- 68% of CIOs say they’re worried about vendor lock-in with public cloud specifically, ranking it just behind SaaS lock-in concerns (78%) (36).
- Security issues and “lack of features” tie as the most-cited reasons CMS users migrate (18% each), followed by difficulty integrating new technology (17%); lack of technical support is the single biggest roadblock cited once a migration is underway (52%) (26).
- 48% of organizations adopting headless architecture cite content centralization as a driver, 47% cite flexibility, and 44% cite the ability to build lighter-weight websites (39).
- The top barriers to headless adoption are organizational hurdles (~70%), budget constraints (65%), and technological challenges (47%), per a 1,015-respondent survey of IT and marketing professionals (40).
Migration Risk Statistics: SEO, Downtime & Project Failure
- Google recommends keeping redirects in place for “at least 1 year” after a migration to allow ranking signals to fully transfer to the new URLs, and Googlebot will follow up to 10 hops in a redirect chain before giving up (16).
- A single 301 redirect can lose roughly 15% of a page’s PageRank equity, and a chain of several redirects compounds that loss to roughly 38% (10).
- In Rand Fishkin’s own documented SEOmoz-to-Moz domain migration, the site logged 342,737 fewer search visits in the 64 days after the switch compared with the 64 days before it, with the lowest point roughly two weeks post-migration (12).
- Across a 2023 study of 171 earlier domain migrations, organic traffic took an average of 229 days to recover, and 42% never fully recovered — the sample nearly quintupled to 892 migrations in the 2025 follow-up study, where average recovery time stretched to 523 days but the non-recovery rate improved to 17% (11).
- Among 5,400+ large IT projects (initial budgets over $15 million), software projects carried the highest risk of cost and schedule overrun of any category studied (18).
- Only 16% of organizations say their digital transformation both improved performance and equipped the headless cms development company to sustain that improvement over time — worth noting since the popular “70% of digital transformations fail” statistic is a commonly misattributed McKinsey figure; McKinsey’s own digital-transformation research puts full success at 16%, not a 30% failure rate from a different, older study (19).
- Roughly 1 in 3 enterprise cloud migration projects fails outright, per Cloud Security Alliance survey data (24).
- ITIC’s 2024 downtime survey found 41% of enterprises report hourly downtime costs of $1 million to over $5 million; separate estimates (Gartner, Ponemon Institute, Avaya) put average per-minute downtime costs anywhere from $2,300 to nearly $9,000 (20, 21).
- For Fortune 1,000 companies specifically, downtime can cost as much as $1 million per hour, per IDC survey data (22).
Migration Case Studies by Platform
Over 30 vendor-published case studies with concrete migration timelines and results — the closest thing to ground truth this category has, though every figure below is vendor-reported.
| Platform | Customer | Migration timeline | Scale | Key result |
|---|---|---|---|---|
| Contentful | Heap | 21 days | 600 pages | Full redesign + migration |
| Contentful | Celonis | 2 weeks | 1,400 pages, 2 languages | Editor access 5 → 85 employees |
| Contentful | Docusign | — | 7,000+ pages, 52+ languages | Update time: 2 weeks → 5 minutes |
| Sanity | DataStax | — | — | Release cycle: 7–10 days → <72h (-70%) |
| Storyblok | Lano | 5 days (bulk); 4 months total | 1,000+ pages, 4 languages | — |
| Storyblok | Virgin Media O2 | 4 days (static pages) | 2,300+ pages | 3,000+ product catalog imported in <1 hour |
| Storyblok | Dojo | 4.5 months | 600+ pages, ~175 content types | 150% faster load, +66% YoY sessions |
| Storyblok | Fundbox | 5 weeks | — | ~⅓ the time of prior 4.5-month relaunch |
| Storyblok | Emarsys | 3 weeks | — | Full delivery + content access |
| Contentstack | Pirelli | 10 months (13-person team) | 218 websites, 150 regions | +75% publishing speed, +55% editing efficiency |
| Contentstack | MongoDB | 8 weeks (full); 3 months (first page live) | 250+ pages | 5x batch-publishing throughput |
| Contentstack | Freeletics | ~3 weeks | 6,000+ pages | Publication cycle: 22.5 → 4.5 days |
| Contentstack | Elastic | 3 months (vs. 6–9 typical) | — | Server costs -87% ($7,000 → $890/mo) |
| Hygraph | Voi | 1–2 months | — | 2x visitors, -50% maintenance cost |
| Hygraph | Dr. Oetker | — | 40+ markets | +57% users |
| Hygraph | Bellhop | 1 month | 200+ pages | 95%+ Core Web Vitals |
| Directus | Lucid Software | — | 15,000+ pages (from Drupal) | — |
| Directus | Divine Persuasion Studio | 3 days (vs. 3 months in Drupal) | — | -20–30% daily client work time |
| Payload | Bizee | 3 months | 2,500 pages | Core Web Vitals: 50 → 90 |
| Builder.io | Uswitch | 3.5 months | 2,919 pages, 6 systems consolidated | 93% automated migration |
| Builder.io | Everlane | — | — | 4x faster product launches |
| DatoCMS | Arduino | — | — | Code base -92.5%, load time 8.3s → <1s |
| Prismic | BforBank | — | — | Translation time: 1 day → 30 min (-95%) |
| Prismic | Evri | — | ~40 reusable slices | CMS team: ~20 → 3–4 people |
| Strapi | Tesco | 3 months | 500,000 users, 24 channels | -50% release cycles |
| Strapi | Finary | — | — | Organic traffic x100 (70,000 sessions/mo) |
| Optimizely | The Royal Mint | — | — | 2x web traffic, 200 payments/min at peak |
Table 1: Vendor-published migration case studies, September 2026. Sources: (42, 43, 44, 45, 46, 47, 48, 49, 50, 51, 52, 53, 54, 55, 56, 57, 58, 59, 60, 61, 62, 63, 64, 65, 66, 67).
WordPress-to-Headless Migration Statistics
- In a fully documented 1,200-page WordPress-to-headless migration, mobile page load dropped from 4.8s to 1.9s (-60%), desktop from 3.1s to 1.2s (-61%), Largest Contentful Paint fell 65%, Time to First Byte fell 94%, mobile PageSpeed score rose from 35 to 92, and bounce rate fell 29% — the original site had run 47 active plugins across 8 years of accumulated technical debt (13).
- Only 68 of the 1,200 pages (5.7%) required manual review during that migration; the rest were migrated programmatically in 4 days, inside a 6-week total project (13).
- WordPress holds roughly 60.7% of the CMS market by one count (down from 65.2% in January 2022), and WordPress sites pass Core Web Vitals mobile checks at just 45%, compared with 85% for Duda and 74% for Wix (2).
- Elastic’s move off WordPress onto a headless architecture cut server costs 87% and development costs 78% while more than doubling page views (49).
Post-Migration Satisfaction & ROI Statistics
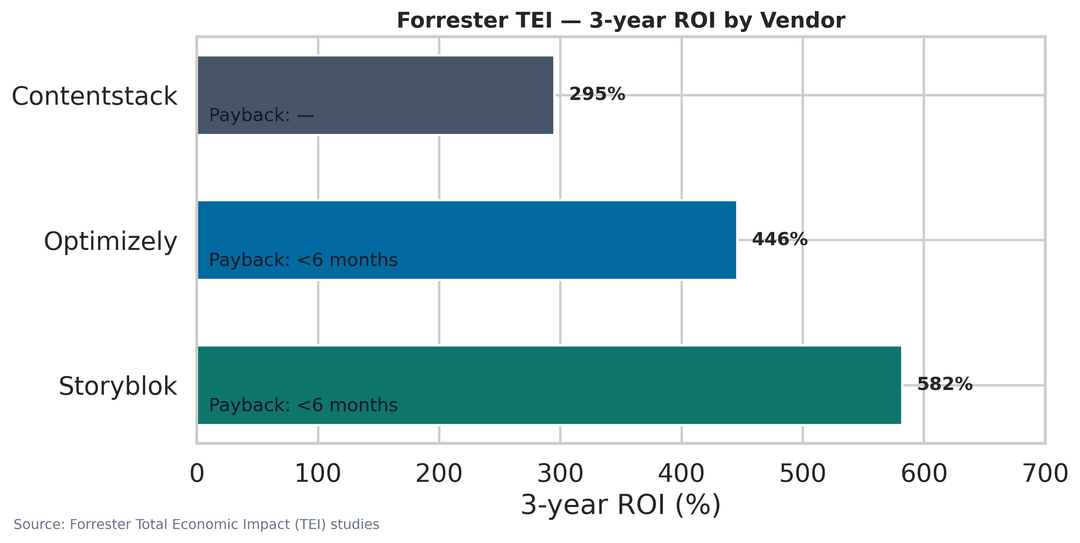 3-yearROI
Table 2: Forrester Total Economic Impact three-year ROI findings, as self-reported in each vendor’s published study. Sources: (33, 41).
- 99% of respondents who switched to a headless CMS reported measurable improvements (only 2 of 1,719 surveyed reported none); 61% cited increased ROI and 58% cited productivity gains (26).
- 79% say their original pain points were mostly or entirely resolved after migrating, while just 1% said issues were barely or not at all resolved (26).
- 88% of respondents who have used a headless CMS express satisfaction with it, per a separate 1,014-person survey (27).
- Optimizely’s Forrester TEI study found organizations recaptured $800,000 over three years simply from retiring legacy systems after migrating, on top of a 40% developer-productivity increase (41).
- 45% of small businesses that relaunched a website outsourced the project to an agency, versus 37% built in-house, and 81% of small businesses have redesigned their website at least once (23).
Final Thoughts
The statistics point to a consistent pattern: migrations that go wrong don’t fail on architecture — they fail on estimation. The 892-migration SEO recovery study, the Standish Group’s 31% on-time/on-budget rate, and McKinsey’s large-IT-project data are all describing the same underlying problem from different angles: teams consistently underestimate how long content migration takes, how long Google takes to fully re-trust new URLs, and how much budget contingency a real enterprise migration needs.
We’ve written about this specifically because it’s where most of our engagements start — not “should we go headless” but “how do we get off what we have without losing six months of rankings or blowing the budget.” Our own breakdown of what an enterprise CMS migration actually costs in 2026 and why 70% of replatforming projects go over budget go into the mechanics behind the numbers above. Our CMS Kit exists specifically to compress that estimation risk — a governed, multi-locale content model and redirect strategy scoped before the RFP is even finished, on Sanity, Storyblok, Payload, DatoCMS, Contentful, or Directus, with 90% of our projects landing within the original budget. If you’re scoping a migration, we can turn around a realistic timeline and cost estimate on an intro call within a day.
References
- Niteco, “CMS replatform change management for enterprise teams” — https://niteco.com/articles/enterprise-replatform-change-management-what-your-content-team-actually-needs-to-know/
- Core dna, “CMS Migration Timeline | How Long Does It Take?” — https://www.coredna.com/help/question/how-long-does-a-cms-migration-take
- Storyblok, “State of CMS 2025” — https://www.storyblok.com/lp/state-of-cms-2025
- Oshyn, “How much time will content migration take?” — https://www.oshyn.com/blog/content-migration-estimation
- Hygraph, “The True Cost of CMS Migration” — https://hygraph.com/resources/cms-migration-guide
- Hygraph, “Voi Customer Success Story” — https://hygraph.com/case-studies/voi-case-study
- FocusReactive, “How Much Does an Enterprise CMS Migration Actually Cost in 2026?” — https://focusreactive.com/blog/enterprise-website-migration/
- FocusReactive, “Website replatforming: The Reasons 70% of Projects Exceed Budget” — https://focusreactive.com/blog/why-70-of-website-replatforming-projects-go-over-budget-and-how-to-prevent/
- Search Engine Journal, “A Guide To Enterprise-Level Migrations (100,000+ URLs)” — https://www.searchenginejournal.com/enterprise-level-migrations-guide/489489/
- Ahrefs, “301 Redirects Explained: How They Impact SEO” — https://ahrefs.com/blog/301-redirects/
- Search Engine Journal (Dan Taylor / 10Spurs), “How Long Should An SEO Migration Take? [Study Updated]” — https://www.searchenginejournal.com/study-how-long-should-seo-migration-take/492050/
- SparkToro (Rand Fishkin), “10 Traffic Graphs from the SEOmoz to Moz Domain Migration” — https://sparktoro.com/blog/10-traffic-graphs-seomoz-moz-domain-migration/
- Last Rev, “WordPress to Headless CMS: 50% Faster Load Times” — https://lastrev.com/blog/wordpress-to-headless-cms-case-study
- DesignRush, “Only 31% of Projects Succeed On Time and On Budget” — https://news.designrush.com/project-success-rate-discovery-phase-scope-creep
- Storyblok, “Headless CMS Pricing vs. Legacy” (Enterprise CMS Cost whitepaper) — https://www.storyblok.com/lp/enterprise-cms-cost
- Google Search Central, “Site Moves and Migrations” — https://developers.google.com/search/docs/crawling-indexing/site-move-with-url-changes
- Google Search Central, “Debug Google Search Traffic Drops” — https://developers.google.com/search/docs/monitor-debug/debugging-search-traffic-drops
- McKinsey & University of Oxford’s BT Centre for Major Programme Management, “Delivering large-scale IT projects on time, on budget, and on value” — https://www.mckinsey.com/capabilities/operations/our-insights/delivering-large-scale-it-projects-on-time-on-budget-and-on-value
- McKinsey, “Unlocking success in digital transformations” — https://www.mckinsey.com/capabilities/quantumblack/our-insights/unlocking-success-in-digital-transformations
- ITIC, “ITIC 2024 Hourly Cost of Downtime Report” — https://itic-corp.com/itic-2024-hourly-cost-of-downtime-report/
- Atlassian, “Calculating the cost of downtime” (citing Gartner 2014, Ponemon Institute 2016, Avaya 2014) — https://www.atlassian.com/incident-management/kpis/cost-of-downtime
- Atlassian, “Calculating the cost of downtime” (citing IDC, Fortune 1000 data) — https://www.atlassian.com/incident-management/kpis/cost-of-downtime
- Clutch, “The State of Small Business Websites in 2025” — https://clutch.co/resources/state-of-small-business-websites-2025
- Instaclustr, “1 in 3 Enterprise Cloud Migrations Fail: How Can Yours Succeed?” — https://www.instaclustr.com/blog/1-in-3-enterprise-cloud-migrations-fail-how-can-yours-succeed/
- Cloudflare Blog, “It’s never been easier to migrate thanks to Cloudflare’s new Migration Hub” — https://blog.cloudflare.com/turpentine-v2-migration-program/
- Storyblok, “State of CMS 2024” — https://www.storyblok.com/mp/state-of-cms-2024
- Kontent.ai, “State of the headless CMS market 2023 report” — https://kontent.ai/resources/state-of-headless-cms/
- Storyblok, “State of CMS 2024” press release — https://www.storyblok.com/mp/scms-2024-pr
- Pegasystems/Savanta, “Average Global Enterprise Wastes More Than $370 Million Every Year Through Technical Debt” (Business Wire) — https://www.businesswire.com/news/home/20251014412055/en/Average-Global-Enterprise-Wastes-More-Than-%24370-Million-Every-Year-Through-Technical-Debt-Says-Research
- Protiviti, “Technical debt remains a major burden” (Global Technology Executive Survey) — https://www.protiviti.com/us-en/global-technology-executive-survey-tech-debt-major-burden
- vFunction, “New Research Reveals Architectural Technical Debt as Most Damaging to Applications Amid $1.52 Trillion Technical Debt Crisis” (Business Wire) — https://www.businesswire.com/news/home/20240513789015/en/New-Research-Reveals-Architectural-Technical-Debt-as-Most-Damaging-to-Applications-Amid-%241.52-Trillion-Technical-Debt-Crisis
- Storyblok x FT Longitude, “Content Debt: A $4.63 Trillion Business Liability” — https://www.storyblok.com/lp/ft-longitude-content-debt-report
- Storyblok, “The Total Economic Impact of Storyblok” (Forrester TEI) — https://www.storyblok.com/lp/tei-study
- LeadDev, “Content debt is now an engineering problem” (citing Storyblok research) — https://leaddev.com/software-quality/content-debt-is-now-an-engineering-problem
- Deloitte, “The hidden drag, quantified: Technical debt’s penalty on value and growth” — https://www.deloitte.com/us/en/insights/topics/technology-management/technical-debt-impact.html
- Solutions Review, “Flexera: 68 Percent of CIOs Worry About Vendor Lock-In with Public Cloud” — https://solutionsreview.com/cloud-platforms/flexera-68-percent-of-cios-worry-about-vendor-lock-in-with-public-cloud/
- DesignRush (Standish Group CHAOS Report), “Only 31% of Projects Succeed On Time and On Budget” — https://news.designrush.com/project-success-rate-discovery-phase-scope-creep
- Adobe, “Hybrid CMS: The Best of Both Worlds” (PDF, citing IDC data) — https://business.adobe.com/content/dam/dx/us/en/resources/reports/hybrid-cms-the-best-of-both-worlds/best-of-both-worlds.pdf
- Adobe, “Hybrid CMS: The Best of Both Worlds” (see 38) — https://business.adobe.com/content/dam/dx/us/en/resources/reports/hybrid-cms-the-best-of-both-worlds/best-of-both-worlds.pdf
- WP Engine, “The State of Headless 2024: Redefining Digital Engagement” — https://wpengine.com/resources/the-state-of-headless-global-research-report/
- Optimizely, “Optimizely Customers Saw 446% 3-year ROI and Sub-Six-Month Payback” (Forrester TEI) — https://www.optimizely.com/company/press/forrester-tei-2025
- Contentful, “Heap” Case Study — https://www.contentful.com/case-studies/heap/
- Contentful, “Celonis” Case Study — https://www.contentful.com/case-studies/celonis/
- Contentful, “Docusign” Case Study — https://www.contentful.com/case-studies/docusign/
- Contentstack, “Pirelli migrates 218 websites in 10 months with Contentstack” — https://www.contentstack.com/resources/case-study/pirelli-migrates-218-websites-in-10-months-with-contentstack
- Contentstack, “MongoDB drives digital modernization with Contentstack” — https://www.contentstack.com/resources/case-study/mongodb-drives-digital-modernization-with-contentstack
- Contentstack, “Freeletics achieves flexibility and future growth with Contentstack” — https://www.contentstack.com/resources/case-study/freeletics-achieves-flexibility-and-future-growth-with-contentstack
- Sanity, “DataStax Customer Story” — https://www.sanity.io/customers/datastax
- Contentstack, “Elastic speeds up development with Contentstack” — https://www.contentstack.com/resources/case-study/elastic-switches-wordpress-for-headless-solution
- Storyblok, “Lano Case Study” — https://www.storyblok.com/cs/lano
- Storyblok, “Virgin Media O2 Case Study” — https://www.storyblok.com/cs/virgin-media-o2
- Storyblok, “Dojo Case Study” — https://www.storyblok.com/cs/dojo
- Storyblok, “Fundbox Case Study” — https://www.storyblok.com/cs/fundbox
- Storyblok, “Emarsys Case Study” — https://www.storyblok.com/cs/emarsys-brand-site
- Hygraph, “Dr. Oetker Customer Success Story” — https://hygraph.com/case-studies/dr-oetker
- Hygraph, “Stobag Customer Success Story” — https://hygraph.com/case-studies/stobag
- Hygraph, “Bellhop and Hygraph Case Study” — Customer Success Story - Dr. Oetker | Hygraphhttps://hygraph.com/case-studies/bellhop-case-study
- Directus, “Lucid Software Case Study” — https://directus.com/resources/lucid-software
- Directus, “From Drupal to Directus: Divine Persuasion’s Journey” — https://directus.com/resources/divine-persuasion-studio
- Payload, “How Payload’s DX reinvented Bizee in three months” — https://payloadcms.com/case-studies/bizee
- Builder.io, “Uswitch Unified 6 Tools Into 1 Visual Dev Platform” — https://www.builder.io/customer-stories/uswitch
- Builder.io, “Everlane goes to market 4X faster with Builder.io” — https://www.builder.io/customer-stories/everlane
- Whitespectre, “Fabletics: Next-Level CMS with Builder.io” — https://www.whitespectre.com/work/fabletics-headless-CMS-case-study/
- DatoCMS, “Arduino Case Study” — https://www.datocms.com/case-studies/arduino
- DatoCMS, “Polestar Case Study” — https://www.datocms.com/case-studies/polestar
- Prismic, “How BforBank Accelerated Global Growth with a CMS Rebuild” — https://prismic.io/case-studies/bforbank
- Prismic, “How Evri Cut Their Time to Ship” — https://prismic.io/case-studies/evri
- Prismic, “SafetyBuyer Increases Key Events by 38% YoY” — https://prismic.io/case-studies/safetybuyer
- Strapi, “Tesco builds an employee portal for 500k users with Strapi” — https://strapi.io/user-stories/tesco
- Strapi, “Finary multiples organic traffic by 100x with Strapi” — https://strapi.io/user-stories/finary
- Strapi, “AE Studio made a nonprofit marketplace using Strapi and Next” — https://strapi.io/user-stories/ae-studio-prosperity
- Optimizely, “The Royal Mint Customer Story” — https://www.optimizely.com/field-notes/customer-stories/royal-mint/
- Optimizely, “RAKBANK Customer Story” — https://www.optimizely.com/field-notes/customer-stories/
- Optimizely, “De Mandemakers Groep Customer Story” — https://www.optimizely.com/field-notes/customer-stories/de-mandemakers-groep/
- Optimizely, “The Gym Group Customer Story” — https://www.optimizely.com/field-notes/customer-stories/the-gym-group/
- Optimizely, “Corinthia Hotels Customer Story” — https://www.optimizely.com/field-notes/customer-stories/corinthia-hotels/
- Kontent.ai, “Motorpoint Customer Success Story” — https://kontent.ai/customers/motorpoint/
- Kontent.ai, Customer Success Stories page (Gordon Ramsay Restaurants, Alaska Airlines, Neilson Financial, Hartlauer) — https://kontent.ai/customers/
- Storyblok, “Headless vs. Monolithic: CMS Usage Statistics & Trends 2025” — https://www.storyblok.com/mp/cms-statistics